Every analytics tool opens on traffic by source. It is the wrong first screen for anyone selling a subscription, and it is wrong in a specific direction: it makes your largest channel look like your best one.
Here is what the same five channels look like when you carry them all the way through to money.
The report you want
| Channel | Visitors | Signups | Customers | MRR | Spend | Still paying at month 3 |
|---|---|---|---|---|---|---|
| Google organic | 2,410 | 61 | 6 | $174 | $0 | 88% |
| Direct | 1,890 | 52 | 7 | $203 | $0 | 79% |
| 1,240 | 88 | 11 | $319 | $0 | 82% | |
| Google Ads | 972 | 76 | 14 | $406 | $2,000 | 71% |
| Newsletter sponsorship | 310 | 41 | 9 | $261 | $600 | 64% |
Read the first column and organic search is your best channel by a distance. Read the last three and it is your worst: 2,410 visitors produced six customers and $174 a month.
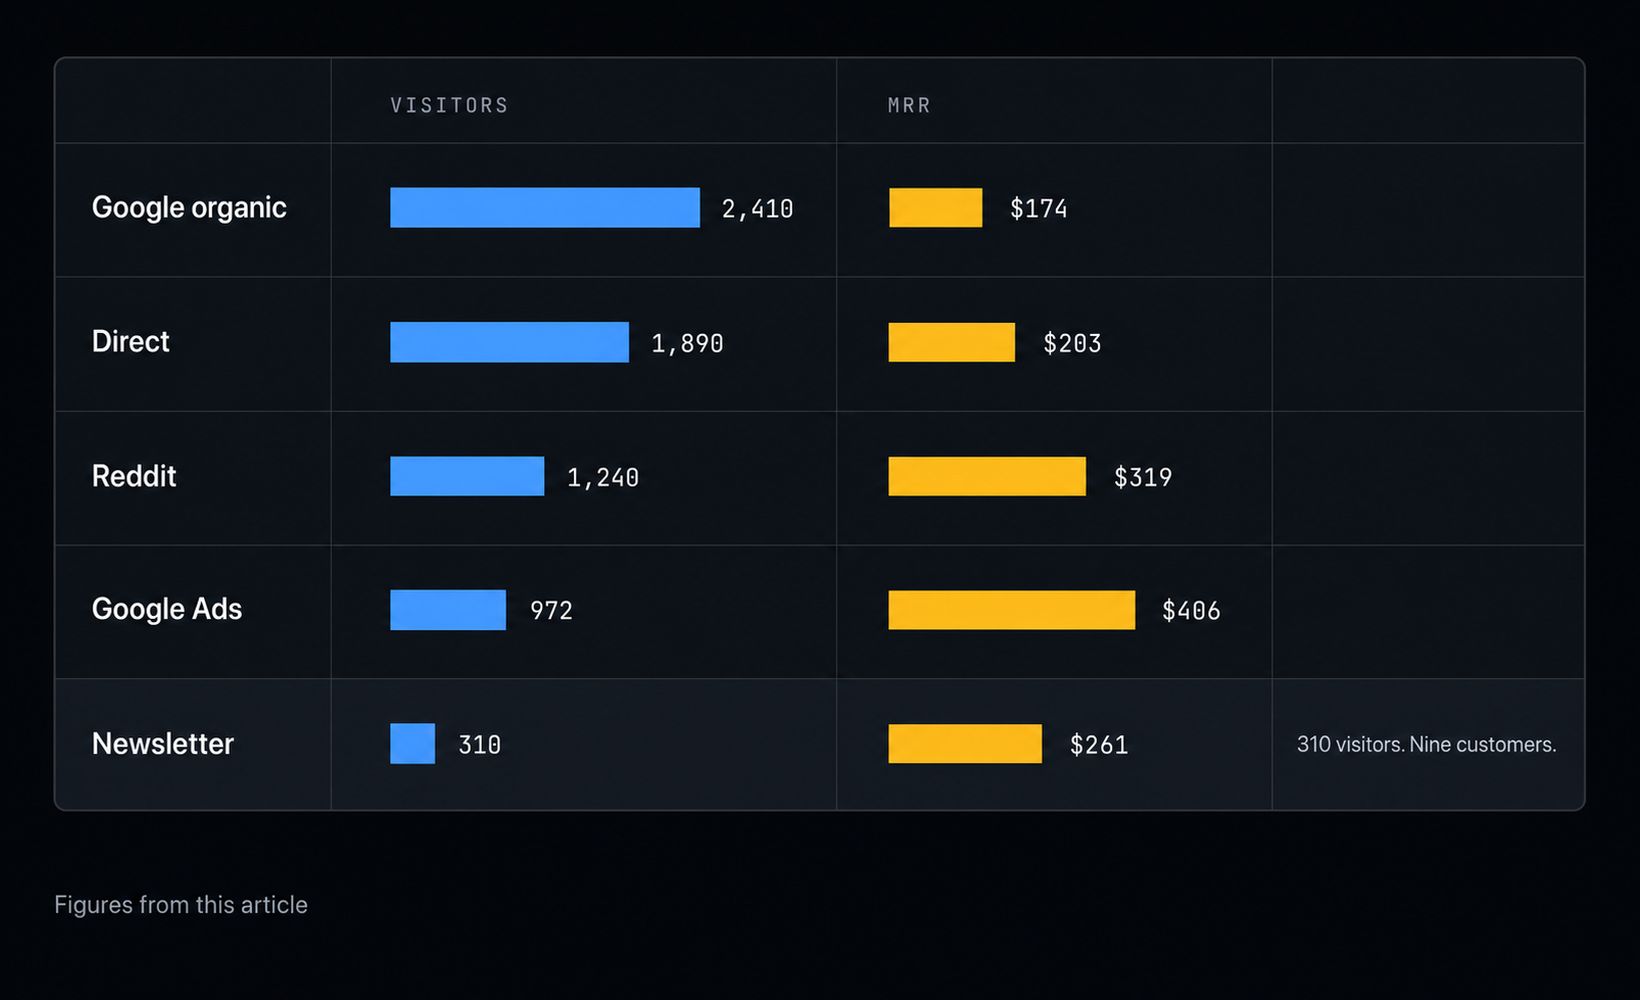
Newsletter sponsorship brought 310 visitors, which would not register on a traffic dashboard, and produced nine customers at $261 a month. It converts nearly eight times better than organic search per visitor. It also has the worst retention on the page, which is the kind of thing you only find out by looking.
Nothing in this table is unusual. Traffic and revenue are only loosely related, and the looser the relationship, the more expensive it is to plan from the traffic number.
Five columns, in order
Visitors is where every tool starts and where most stop. It is useful only as a denominator.
Signups is the first real filter, and the ratio between it and visitors tells you whether the traffic was qualified. Reddit at 88 signups from 1,240 visitors (7.1%) against organic search at 61 from 2,410 (2.5%) is the interesting comparison, and neither number means anything on its own.
Customers is where most channels stop being interesting. Signups are free to give away and cost you support time. This column is the first one that is unambiguously good news.
MRR matters separately from customer count because channels bring different customers. If one channel produces customers who all pick the $9 plan and another produces $49 accounts, the customer column will mislead you.
Retention at month three is the column almost nobody has, and it is the one that changes decisions. A channel at 64% three-month retention loses over a third of what it brought before it has paid for itself. That is not a marketing problem, it is a signal about who that channel is sending you.
First touch, not last click
Someone reads a comparison post on Reddit in March. Nothing happens. In April they remember it, search your product name, and sign up.
Last-click attribution records that as organic search or direct. First-touch records it as Reddit. Both are defensible and for a small product first touch is the more useful of the two, because the decision you are making is where to spend the next hundred dollars of effort, and the thing that created the demand is the thing worth repeating.
The practical version: store the first referrer and campaign you ever see for a visitor, keep it when they sign up, and never overwrite it. Most tools default to last touch, and many do not keep a first-touch value at all. It is worth checking which yours does before you plan a quarter around the output.
Three things that break this report
Dark traffic. Links opened from Slack, iOS Mail, Discord, most desktop mail clients and anything pasted into a message arrive with no referrer and land in Direct. AI assistants are the newest and fastest-growing source of this. If Direct is more than about a third of your traffic and you are not a known brand, a real channel is hiding in there. Tag every link you control. Our UTM builder is free and flags the usual mistakes.
Inconsistent tags. utm_source=Twitter and utm_source=twitter are two channels in most tools, as are x.com and twitter.com. One channel split four ways is four rows too small to notice. Lowercase everything and write down your medium values once.
Comparing the wrong periods. This month’s visitors did not produce this month’s customers. For a considered purchase the lag is weeks to months, so the report has to be built by acquisition cohort: of the people who first arrived in March, how many had paid by June, and how many were still paying in September.
Then the column that decides the budget
Once you have spend and retention per channel, you can compute the only number that actually determines where money goes: how many months until a channel has returned what it cost.
From the table above, Google Ads cost $2,000 and produced 14 customers, so $143 each. At $29 a month and 85% margin, each contributes $24.65. At the 71% three-month retention shown, monthly churn is around 11%, and the cumulative contribution crosses $143 somewhere around month nine.
Newsletter sponsorship cost $600 for 9 customers, so $67 each, and pays back in month three despite having the worst retention on the page, because it was cheap.
The free channels pay back immediately in cash terms, which is why they look infinitely good and why founders over-index on them. They are not free. Reddit cost you the hours you spent being useful in threads, and organic search cost you whatever writing 2,410 visitors’ worth of content cost. Put a number on your own time or you will conclude that content beats everything and then wonder why nothing shipped this quarter.
The full arithmetic on payback, including the condition under which a channel never pays back at all, is worth reading before you act on any of this.
Building it
Three data sources have to meet.
Traffic and first touch, from an analytics tool that stores first-touch attribution rather than overwriting it.
Signups and customers, from your database, joined to that first touch. This means passing an identifier through signup so the anonymous visitor and the account become one person.
Revenue and cancellations by month, from Stripe or whichever provider you use. Monthly series, not lifetime totals, or you cannot build the retention column.
Doing this by hand is a spreadsheet, an afternoon to set up and about an hour a month afterwards. Plenty of people run their business that way for years and it is a perfectly respectable answer.
We build Ripples because we got tired of that hour. It joins those three sources automatically, attributes to first touch, and prints the table above including the payback column, with Google Ads spend imported on every plan including the free one. Free until your project reaches $1K MRR, one script tag. Where the tools that do part of this beat us, we say so.
The short version
Traffic by source rewards whichever channel sends the most people, which is rarely the channel that sends the best people. Add signups, customers, revenue, retention and spend, and the ranking usually inverts. Then stop funding the top of the old list.
Sources
- CAC payback period: how to calculate it
- Why your analytics says 200 visitors and Stripe says 2 customers
- Ripples UTM builder and retention curve calculator
The table in this article is a worked example built on the conversion and retention ranges typical of small B2B software. Your own numbers will differ, and the point of the article is that you should know by how much.