Most advice about Google Ads for small software products stops at “track conversions”. That is where the interesting part starts, because for a subscription product the conversion is worth almost nothing on the day it happens and you will not know what it was worth for months.
What follows is a worked $2,000 test on a $29 a month product, run through the arithmetic properly. The figures are a model built on this category’s real benchmarks rather than a screenshot of one account, and every step is shown so you can put your own numbers in. If you want the calculator instead of the reasoning, it is here and it is free.
The setup
A $29 a month B2B tool. Gross margin 85%, which is normal once you subtract Stripe fees and hosting, so each customer contributes $24.65 a month rather than $29. Two ad groups, both search, no display and no Performance Max.
Spend split $700 on competitor and alternative terms, $1,300 on generic category terms. Eight weeks. $2,000 total.
What $2,000 bought
| Competitor terms | Generic terms | Total | |
|---|---|---|---|
| Spend | $700 | $1,300 | $2,000 |
| Average CPC | $2.60 | $1.85 | $2.06 |
| Clicks | 269 | 703 | 972 |
| Signup rate | 11% | 6.5% | 7.8% |
| Signups | 30 | 46 | 76 |
| Signup to paid | 27% | 13% | 18% |
| Paying customers | 8 | 6 | 14 |
| Cost per customer | $87.50 | $216.67 | $142.86 |
Fourteen customers for $2,000. First month revenue from them is 14 times $29, so $406.
The number that will make you turn the ads off
Return on ad spend in month one: $406 against $2,000, which is 0.20. Twenty cents back per dollar spent.
If you are looking at a ROAS column, that is where you stop the campaign. It is also completely the wrong read, because you have compared eight weeks of spend against one month of revenue from a product that bills every month. The revenue has barely started arriving.
ROAS is a fine metric for a shop selling a $60 pair of headphones once. For a subscription it is a snapshot of a film. The question is not what came back this month, it is how many months until it has all come back.
The payback curve
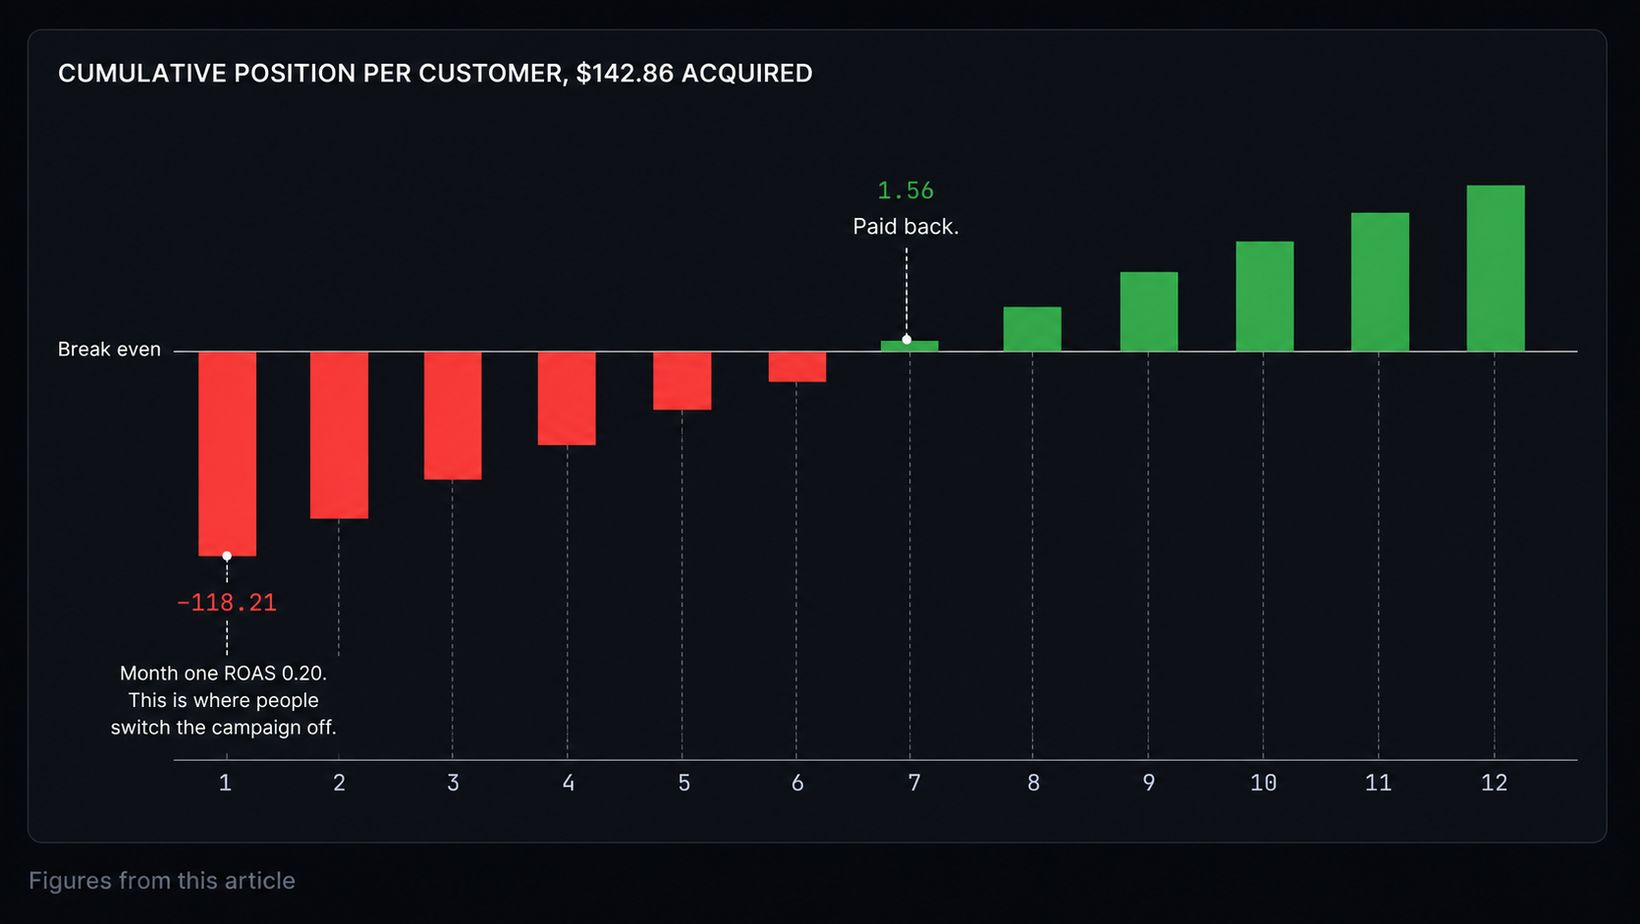
Payback period is the month in which cumulative gross profit from a cohort passes what the cohort cost to acquire. Blended cost per customer here is $142.86, and each customer contributes $24.65 a month while they stay.
At 6% monthly churn, blended across both ad groups:
| Month | Contribution that month | Cumulative | Against $142.86 |
|---|---|---|---|
| 1 | $24.65 | $24.65 | -$118.21 |
| 2 | $23.17 | $47.82 | -$95.04 |
| 3 | $21.78 | $69.60 | -$73.26 |
| 4 | $20.47 | $90.07 | -$52.79 |
| 5 | $19.25 | $109.32 | -$33.54 |
| 6 | $18.09 | $127.41 | -$15.45 |
| 7 | $17.01 | $144.42 | +$1.56 |
Month seven. Without churn the arithmetic says 5.8 months, so churn added a bit over a month. That is a campaign worth running, and a ROAS column told you to kill it in week three.
The blended number is still lying to you
Now split the same cohort by ad group, and use the churn each group actually shows. Competitor-intent traffic retains better than generic category traffic, reliably enough that you should assume it until your own data says otherwise. Call it 4% monthly for competitor terms and 9% for generic.
Competitor terms. $87.50 per customer, 4% churn.
| Month | Cumulative | Against $87.50 |
|---|---|---|
| 1 | $24.65 | -$62.85 |
| 2 | $48.31 | -$39.19 |
| 3 | $71.03 | -$16.47 |
| 4 | $92.84 | +$5.34 |
Generic terms. $216.67 per customer, 9% churn.
| Month | Cumulative | Against $216.67 |
|---|---|---|
| 3 | $67.49 | -$149.18 |
| 6 | $118.35 | -$98.32 |
| 9 | $156.68 | -$59.99 |
| 12 | $185.57 | -$31.10 |
| 17 | $218.77 | +$2.10 |
Four months against seventeen. The blended “month seven” describes neither of them and would have you keep funding both at the current split.
There is a harder fact buried in the second table. At 9% monthly churn, a customer contributes $24.65 divided by 0.09, so about $274 in total, ever. The generic ad group costs $217 to acquire one. That group is not a growth channel, it is a way of turning $217 into $274 over eighteen months while you carry the cash gap. Push CPCs up 30% in a competitive quarter and it stops working entirely.
What we would do with the next $2,000
Move the money to where the payback is, and keep watching whether the payback holds when you spend more. It usually degrades, because the cheapest and most intent-heavy searches are the ones you were already winning.
The specific steps, in order:
Cap the generic group rather than deleting it. It is the group that produces search terms worth turning into content and new keyword ideas, and that is worth something even at a bad CPA.
Put the freed budget on competitor and alternative terms, then check the payback again at the new spend level. If month four becomes month six, that is still fine. If it becomes month eleven, you have found the ceiling of that ad group and the answer is to stop increasing it.
Watch the search terms report weekly, not monthly. Broad match on a $2 CPC will find you jobseekers, students and people looking for a free version, and every one of those clicks is charged at the same rate as the good ones.
Do not touch Smart Bidding until you are feeding it a conversion that means something. A signup is not a customer. If you optimise towards signups you will get very good at buying the cheapest possible signups, which is exactly what the generic ad group was already doing.
How to run this on your own account
You need three things joined together, and the joining is the whole difficulty.
Daily spend per campaign, from Google Ads. Available in the interface, and via the API if you want it automatically.
Which customers came from which campaign. This is where it usually breaks. The gclid parameter on the click has to survive from the ad, through the landing page, past a signup that may happen days later, and onto the Stripe customer record. If you store it at first touch and copy it onto the customer, the join works. If you only read it at checkout, you will attribute every customer who thought about it overnight to direct traffic.
Revenue and cancellations per customer, per month, from Stripe. Not lifetime totals. You need the monthly series or you cannot build the cumulative column.
With those three you can build the tables above in a spreadsheet. It takes an afternoon the first time and about an hour a month afterwards, forever.
We build Ripples, which does this join and prints the payback month per channel without the spreadsheet, so read that recommendation with the obvious discount. It imports Google Ads spend on every plan including the free one, attributes Stripe revenue to first touch, and splits retention by acquisition channel, which is what turns the blended table into the two tables that actually decide the budget. It is free until your project reaches $1K MRR. The comparison against the tools that do part of this is on the site, including where they beat us.
The short version
First-month ROAS on a subscription product is not a signal, it is an artefact of billing frequency. Payback period is the number, churn changes it by more than people expect, and any payback number averaged across ad groups is hiding the decision you actually need to make.
Sources and assumptions
The model above uses: $29 monthly price, 85% gross margin, 6% blended monthly churn (4% competitor terms, 9% generic), CPCs of $2.60 and $1.85. Category CPCs come from Google Keyword Planner data for analytics and SaaS terms in the US, where top-of-page bids for commercial terms in this space commonly run between $5 and $25, and long-tail terms considerably lower. Substitute your own figures before making any decision with this.